SCM KPI Dashboards
Supply Chain Management (SCM) dashboards have moved beyond
simple spreadsheets to real-time command centers. To measure success
effectively, you need to look at both the physical movement of goods and the
financial health of the network.
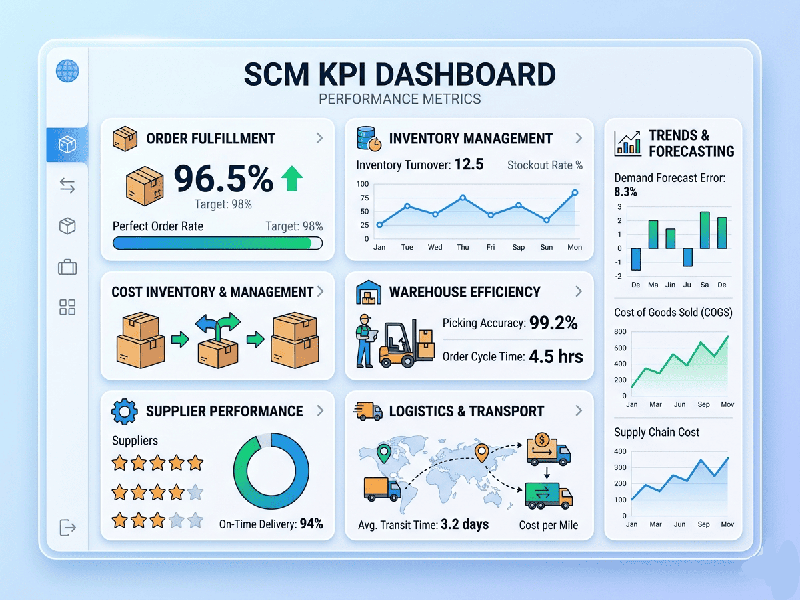
The "Operational Velocity" Dashboard
Best for: Logistics managers, warehouse supervisors, and fulfillment teams.
This dashboard focuses on speed, accuracy, and flow.
It tells you how efficiently your products are moving from the manufacturer to
the end customer.
- Perfect Order Rate: The percentage of orders that
meet all delivery requirements (right product, on time, undamaged, with
correct documentation). This is the "gold standard" for
operational success.
- Order Cycle Time: Measures the total elapsed time
from when a customer places an order to when they receive it.
- Inventory Turnover: How many times a company has
sold and replaced its inventory during a specific period. High turnover
generally indicates strong sales and efficient buying.
- Freight Cost per Unit: Breaks down total shipping
costs by individual item, helping to identify which shipping lanes or
carriers are becoming too expensive.
- Warehouse Capacity Utilization: Tracks how much of your storage
space is actually being used to ensure you aren't paying for "dead
air."