Observability for Multi-Cloud
Observability for multi-cloud environments is the
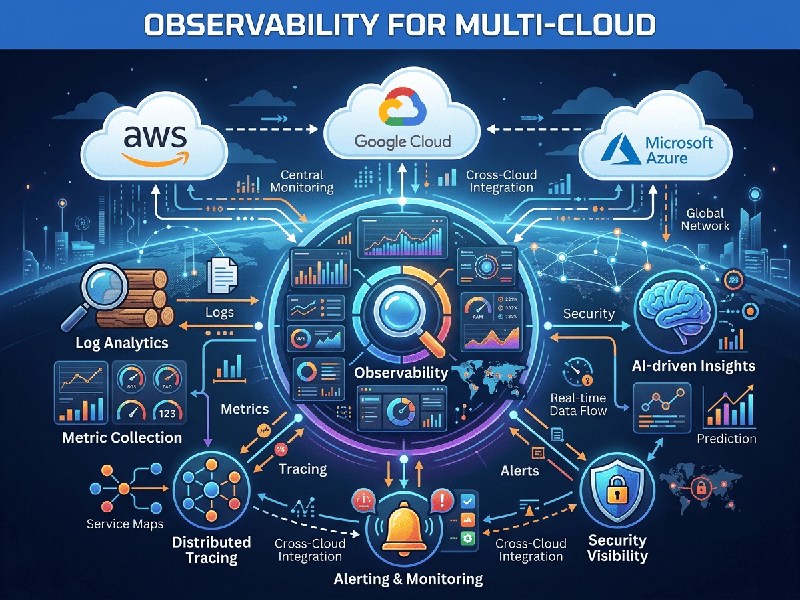
practice of collecting, correlating, and analyzing telemetry data across
diverse cloud providers (e.g., AWS, Azure, Google Cloud) and on-premises
infrastructure to gain a unified understanding of system health.
Unlike traditional monitoring, which simply alerts you
that a system is broken, observability allows you to ask "why"
by analyzing the internal state of your systems based on their external
outputs.
The Three Pillars of Observability
To effectively manage a multi-cloud footprint, your
observability strategy must capture three types of telemetry:
- Metrics: Numerical data measured over
time (e.g., CPU usage, request latency, error rates). These tell you that
a problem is occurring.
- Logs: Immutable, time-stamped records
of discrete events (e.g., application errors, security audit trails).
These provide the context for what happened.
- Traces: Information about the lifecycle
of a request as it moves through various microservices and cloud
environments. These are essential for debugging where a bottleneck
or failure is located in a distributed system.
Key Challenges in Multi-Cloud Observability
1.
Data Silos:
Each cloud provider (e.g., AWS CloudWatch, Google Cloud Operations) has
proprietary tools that do not natively "talk" to each other.
2.
Increased Complexity: The sheer volume of traffic and inter-cloud dependencies makes it
difficult to track a single user request.
3.
Cost Spikes:
Storing and transmitting massive amounts of telemetry data across cloud
boundaries can lead to significant egress costs.
4.
Tool Fatigue:
Managing separate dashboards for every provider leads to
"swivel-chair" operations, increasing mean time to repair (MTTR).
Implementation Strategy
To achieve a "single pane of glass" view,
consider these best practices:
- Adopt Open Standards: Utilize open-source frameworks
like OpenTelemetry (OTel). It provides a standardized way to
instrument, generate, collect, and export telemetry data, preventing
vendor lock-in.
- Unified Monitoring Platform: Use a vendor-agnostic
observability platform (e.g., Datadog, New Relic, Dynatrace, or
Grafana/Prometheus) that can ingest data from multiple cloud APIs via
standardized connectors.
- Centralized Correlation: Ensure your data is tagged with
metadata (e.g., cloud_provider, region, environment) so you can filter and
correlate issues across different platforms in one query.
- Implement Distributed Tracing: Since your services likely span
multiple clouds, end-to-end tracing is the only way to visualize the path
of a request as it hops between different infrastructure environments.