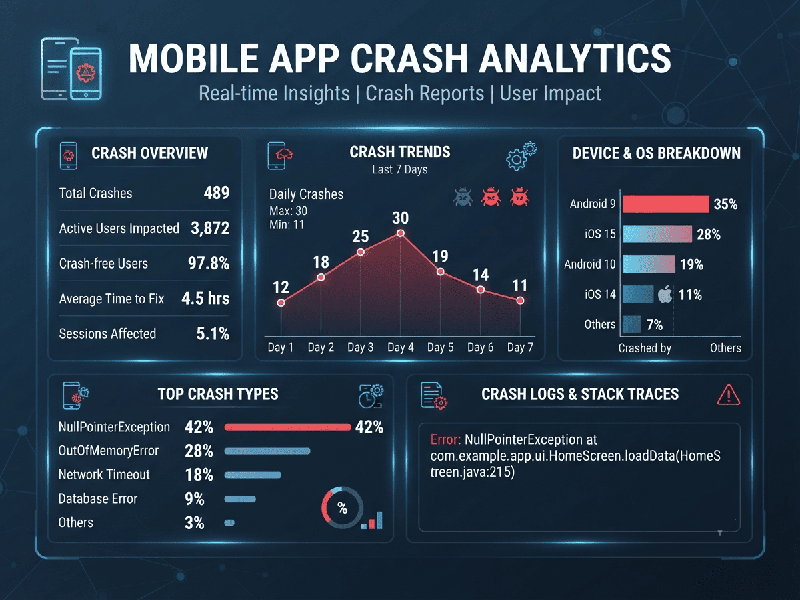
Mobile App Crash Analytics
Mobile app crash analytics tools are essential for
monitoring stability, diagnosing the root causes of unexpected closures, and
improving user retention. These tools capture technical data during a
crash—such as stack traces, device information, and user breadcrumbs—to help
developers resolve issues quickly.
How Crash Analytics Work
When an app crashes, these tools typically perform the
following steps to provide actionable insights:
1.
Detection: The
integrated SDK monitors for unhandled exceptions, signals (like SIGSEGV), or
OS-level terminations.
2.
Data Capture:
The tool collects diagnostic metadata, including the stack trace (the
sequence of code execution), device/OS version, network state,
and breadcrumbs (the sequence of user actions before the crash).
3.
Reporting & Symbolication: Raw crash data is sent to the analytics server, where it is
"symbolicated"—translating machine code into human-readable code
using uploaded symbol files (dSYMs for iOS or mapping files for Android).
4.
Grouping & Alerting: Similar crashes are grouped together so you can see which
issues affect the most users. Real-time alerts notify the team if crash rates
exceed specific thresholds.
Essential Features to Look For
When selecting a tool for your application, prioritize
these features:
- Real-time Alerts: Instant notifications for new
or spike-level crashes allow for rapid response.
- Symbolication Support: Essential for making sense of
obfuscated or native code stack traces.
- ANR Monitoring: Crucial for Android apps to
detect when the UI thread is blocked and the app becomes unresponsive.
- Breadcrumbs: A log of user interactions
leading up to the crash, which provides necessary context for reproducing
the issue.
- Integration: Look for seamless support for
your tech stack (e.g., Kotlin Multiplatform, React Native) and CI/CD
workflows.