Improving Cash Flow Forecasting with Analytics
Historically, cash flow forecasting was a reactive process:
accounting teams looked at past invoices and bank statements, made educated
guesses about collection timelines, and put together static spreadsheets that
were outdated the moment they were saved.
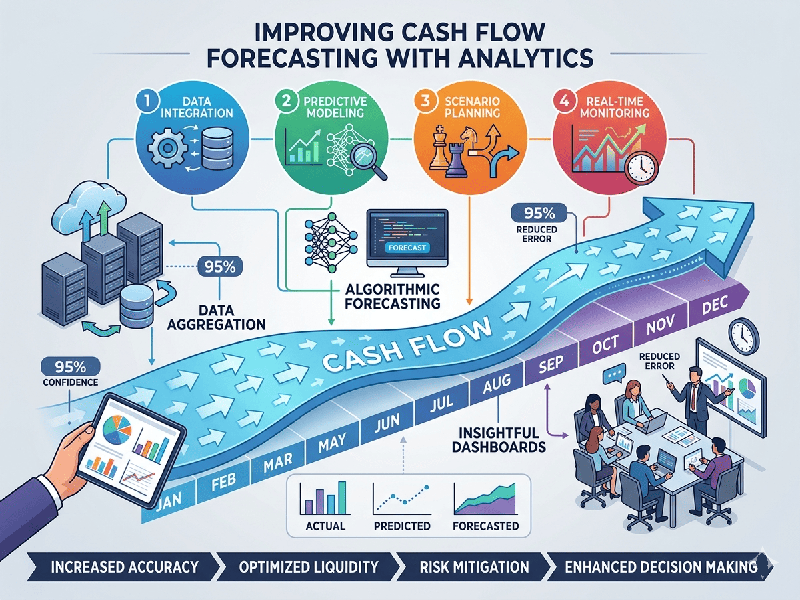
By replacing manual entry with integrated data pipelines and
predictive analytics, enterprises shift from historical reporting to
proactive cash management. This allows finance teams to optimize working
capital, negotiate better credit terms, and strategically time capital
expenditures (CapEx).
1. Transforming the Cash Flow Framework
Moving from traditional to predictive analytics requires
upgrading how data is collected, consolidated, and processed across business
units.
- Real-Time Data Integration: Instead of waiting for monthly
reconciliations, automated analytics engines pull daily transaction data
directly from bank feeds, accounts receivable (AR), accounts payable (AP),
and sales pipelines.
- Dynamic DSO & DPO
Calculation:
Instead of assuming a flat 30-day payment cycle, analytics engines track
actual historical behavior to assign dynamic Days Sales Outstanding
(DSO) metrics down to individual clients and Days Payable
Outstanding (DPO) trends to specific vendors.
2. Advanced Analytics Techniques for Cash Optimization
Implementing advanced analytics allows finance teams to
uncover hidden liquidity and anticipate shortfalls weeks before they happen.
Statistical and Predictive Modeling
Traditional forecasts struggle with nuance. By applying
time-series forecasting models (like ARIMA or Prophet), analytics software can
parse years of historical bank data to automatically identify hidden seasonal
dips, recurring quarterly operational expenses, and macro-economic payment
slow-downs.
Customer Payment Behavior Analytics
Not all clients stick strictly to their invoice terms.
Machine learning classification models can scan past invoice histories to
calculate a "Probability of Late Payment" score for open invoices. If
a major distributor consistently pays 12 days late during their regional
monsoon or financial off-season, the forecast automatically shifts that
expected inflow out by 12 days.
Automated Scenario Simulation (Stress Testing)
Instead of manually tweaking cells in a spreadsheet, variance
engines run automated Monte Carlo simulations to test how cash positions would
respond to sudden market changes.
Example Scenario Analysis: What happens to our net cash position if our top supplier raises material costs by 8%, raw material shipping times slow down by 14 days, and a major customer delays a ₹10,000,000 payment by two weeks?