ERP Reporting Dashboards That Leaders Love
To create ERP reporting dashboards that leaders truly value,
shift your mindset from reporting data to driving decisions. In
2026, the best dashboards function as real-time "decision surfaces"
rather than static documents.
1. The "Decision-First" Design Philosophy
Before picking metrics or charts, ask your leadership team: "What
are the 3–5 recurring decisions you make every week or month?" * Actionable
over Informational: If a metric doesn't trigger a potential action (e.g.,
reallocating budget, adjusting production schedules, revisiting inventory
strategy), it doesn't belong on the executive view.
- The 5-Second Rule: A leader should be able to
grasp the overall health of their domain within five seconds of opening
the dashboard.
- Progressive Disclosure: Use a clean, clutter-free
high-level summary at the top, then provide "drill-down"
capabilities to investigate the granular details when they need to know
"why" a number is trending a certain way.
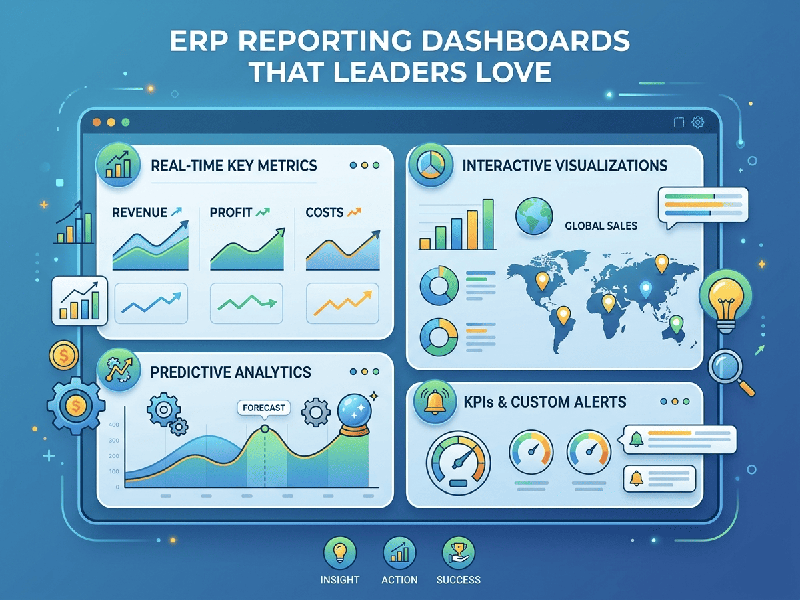
2. Best Practices for Executive Dashboards (2026)
- Standardize Your
"Truth": Ensure the dashboard pulls from a unified data model (CRM,
Finance, and Operations combined). Leaders hate "version
mismatch" where different departments present conflicting numbers.
- Contextualize with Color: Use intuitive signaling—Green
(on track), Yellow (warning/threshold approaching), Red
(requires immediate intervention).
- Leading vs. Lagging: Don't just report what happened
last month (lagging). Include predictive/leading indicators (e.g.,
pipeline health, customer engagement scores) that hint at where the
business is heading.
- Mobile-First Accessibility: Executives are rarely tied to
their desks. Ensure your dashboards are fully responsive and readable on
mobile devices.
- Automated Alerting: Instead of forcing leaders to
"check" the dashboard, configure automated alerts when KPIs
cross pre-set thresholds (e.g., inventory levels dropping below safety
stock).
3. How to Evolve with the Business
A dashboard built for last quarter’s priorities will likely
fail next quarter.
- Iterate Constantly: Treat the dashboard as a living
product. Gather feedback every 2–4 weeks initially to ensure the metrics
remain aligned with shifting strategic priorities.
- No-Code Flexibility: Whenever possible, use
platforms that allow non-technical business users to adjust views or
create new widgets without waiting for IT development cycles.
- Foster Shared Language: When finance, operations, and
sales look at the same unified dashboard, conversations stop being about
"whose numbers are right" and start being about "what do
these numbers mean for our strategy?"
4. Implementation Checklist
- Identify Audience:
Tailor views for specific roles (e.g., CFO needs cash flow/margin; COO
needs fulfillment/utilization).
- Clean the Data:
Ensure the ERP is feeding clean, validated data. A dashboard is only as
trusted as the data behind it.
- Select KPIs (Limit to 8–12): Resist the urge to include everything; too much data creates "analysis paralysis."