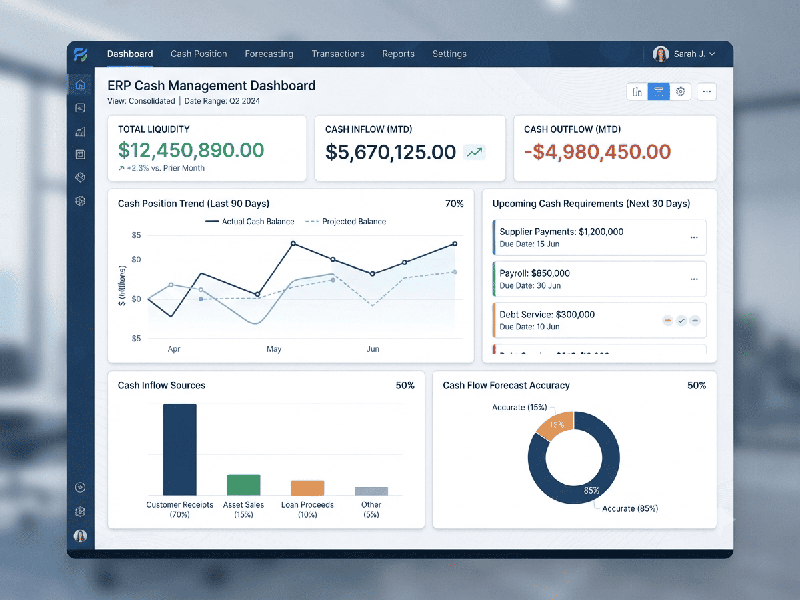
ERP Cash Management Dashboards
An ERP Cash Management Dashboard is a centralized,
visual interface that provides real-time insights into an organization's
liquidity, helping finance teams and executives monitor, analyze, and optimize
cash flow. By integrating data from accounts receivable (AR), accounts payable
(AP), and banking modules, it transforms raw transaction data into actionable
intelligence.
Key Components of an Effective Dashboard
A high-performing dashboard typically includes the
following elements to ensure visibility and proactive decision-making:
- Core Liquidity KPIs:
o Cash Position: Real-time visibility into total bank
balances across all accounts.
o Days Sales Outstanding (DSO): Measures the average time to collect
revenue.
o Days Payable Outstanding (DPO): Measures the average time taken to
pay creditors.
o Cash Conversion Cycle: Tracks the time taken to convert
resources into cash inflows.
- Visualizations:
o Cash Flow Trends: Graphical charts showing historical,
current, and projected cash inflows and outflows.
o Burn Rate: Visualization of cash consumption
over time.
o Budget vs. Actual: Comparison of planned financial
targets against real-time performance.
- Operational Panels:
o Aging Reports: Summaries of accounts receivable and
payable to identify bottlenecks.
o Projections: AI-driven or formulaic forecasts of
future cash positions.
o Drill-Down Tools: The ability to click on a metric
(e.g., total AR) to see the underlying transactions for deeper analysis.
- Alerts & Notifications:
o Real-time warnings regarding
potential cash shortages, delayed payments, or significant anomalies.