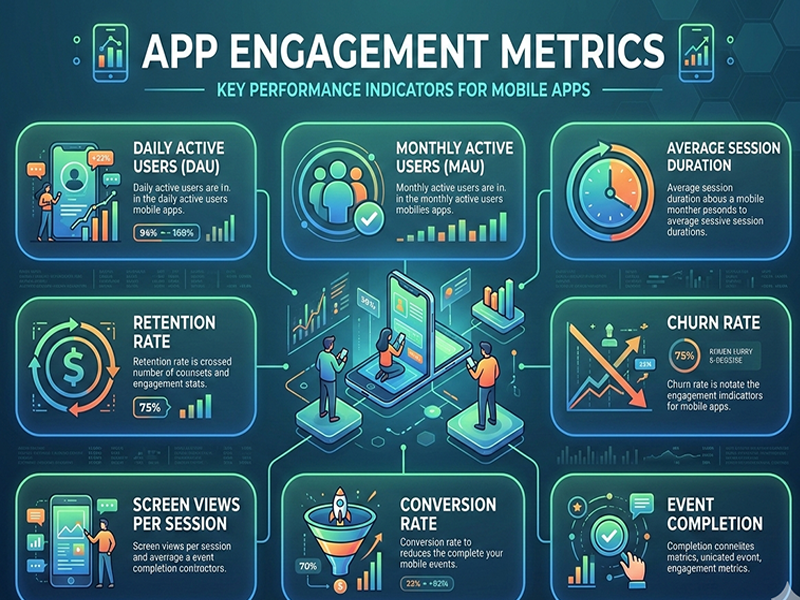
App Engagement Metrics
App
engagement has shifted from tracking "vanity metrics" (like total
downloads) to measuring depth of value and habit formation. With
users becoming more selective about their digital space, engagement metrics now
focus on how effectively an app integrates into a person's daily routine.
1. Core
Popularity and Reach
These
provide the foundation for understanding your total active audience.
- DAU (Daily Active Users): The number of unique users who
open your app in a 24-hour period.
- MAU (Monthly Active Users): The number of unique users over
a 30-day period.
- Stickiness Ratio ($DAU/MAU$): This is the ultimate
"habit" metric. It measures what percentage of your monthly
users return daily.
- Benchmark: 20% is considered good; 25%+
is world-class (common for social media or essential utility apps).
2. Depth
and Quality of Usage
In 2026,
"time spent" is less important than "meaningful action."
- Average Session Duration: How long a user stays in the
app per visit.
- Note: In 2026, shorter sessions for
e-commerce can actually be a positive sign of efficient UI, whereas for
entertainment (e.g., TikTok/YouTube), longer is better.
- Feature Adoption Rate: The percentage of users who
engage with a specific core feature. This helps you identify if your
"cool new update" is actually providing value.
- Screens per Session: The number of unique screens a
user visits. High numbers suggest deep exploration; very high numbers
without conversion might suggest the user is lost.
- Session Interval: The time between two
consecutive sessions. Shorter intervals indicate a stronger user habit.
3.
Retention and "Health" Metrics
Engagement
is meaningless if users leave after three days.
- Retention Rate (Day 1, 7, and
30): The
percentage of users who return after their first day.
- 2026 Trend: Day-30 retention is the new
gold standard for "Product-Market Fit."
- Churn Rate: The percentage of users who
stop using the app. In 2026, "uninstalls" are tracked more
aggressively as a primary churn signal.
- Crash Rate: The percentage of sessions that
experience a technical failure.
- Benchmark: Must stay below 1% to
avoid a massive drop in engagement and App Store rankings.
4.
Monetization and Value
How
engagement translates into business sustainability.
- ARPU (Average Revenue Per User): Total revenue divided by total
active users.
- LTV (Lifetime Value): The total revenue you expect to
earn from a user throughout their entire relationship with the app.
- Conversion Rate: The percentage of users who
perform a specific goal (e.g., buying a subscription, signing up for a
newsletter).