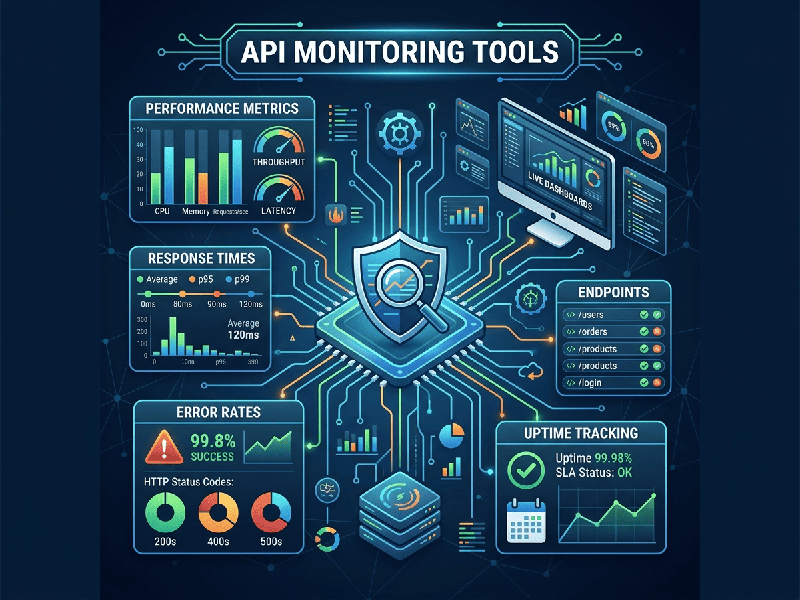
API Monitoring Tools
API Monitoring Tools allow development, DevOps, and security teams to
track the availability, latency, response accuracy, and security posture of
Application Programming Interfaces (APIs).
Because APIs serve as the backbone for modern
microservices, single-page applications, mobile backends, and third-party
integrations, continuous monitoring ensures that endpoints remain functional,
performant, and secure.
1. Categories of API Monitoring
API monitoring generally falls under three primary
architectural approaches:
- Synthetic API Monitoring (Active
Testing):
Simulates external user requests at scheduled intervals (e.g., every 1 to
5 minutes) from multiple global locations. It verifies HTTP status codes,
payload structures, schema assertions, and multi-step API transactions.
- Real-User / Real-Traffic
Observability (Passive Monitoring): Monitors live production traffic, distributed tracing,
and real-time metrics (like error rates or latency bottlenecks) using
agents, OpenTelemetry, or eBPF kernel-level instrumentation.
- API Security & Posture
Monitoring:
Analyzes API traffic for rate-limit breaches, authentication/authorization
failures, data exfiltration, shadow API deployment, and API schema drift.
2. Top API Monitoring Tools
A. Dedicated Synthetic &
"Monitoring-as-Code" Tools
- Checkly: Built specifically for
developers using a "Monitoring-as-Code" workflow. Allows
engineers to write programmable JavaScript/Node.js API checks
version-controlled alongside application code.
- UptimeRobot / Better Stack: Lightweight, cost-effective
synthetic monitoring platforms ideal for uptime tracking, response time
alerting, and basic JSON assertions.
- Uptrends / Catchpoint: Enterprise-grade synthetic
testing platforms capable of executing multi-step API transaction
workflows from hundreds of global testing locations.
B. Full-Stack Observability & APM Platforms
- Datadog / New Relic: Comprehensive platforms that
combine synthetic API checks with deep distributed tracing, log
management, and backend dependency mapping.
- Grafana + Prometheus /
OpenObserve: Open-source
and cloud observability stacks where API metrics and synthetic test
outputs are stored alongside system logs, traces, and metrics using open
telemetry standards.
C. API Development & Testing Platforms
- Postman: Extends API collections built
during development into automated, scheduled monitors to continuously test
staging and production endpoints.
D. API Security & eBPF-Powered Observability
Levo.ai / Traceable.ai: Uses passive tracing and eBPF
technology to monitor API health, detect sensitive data leaks, identify broken
object-level authorization (BOLA), and flag undocumented endpoints without
adding latency overhead.