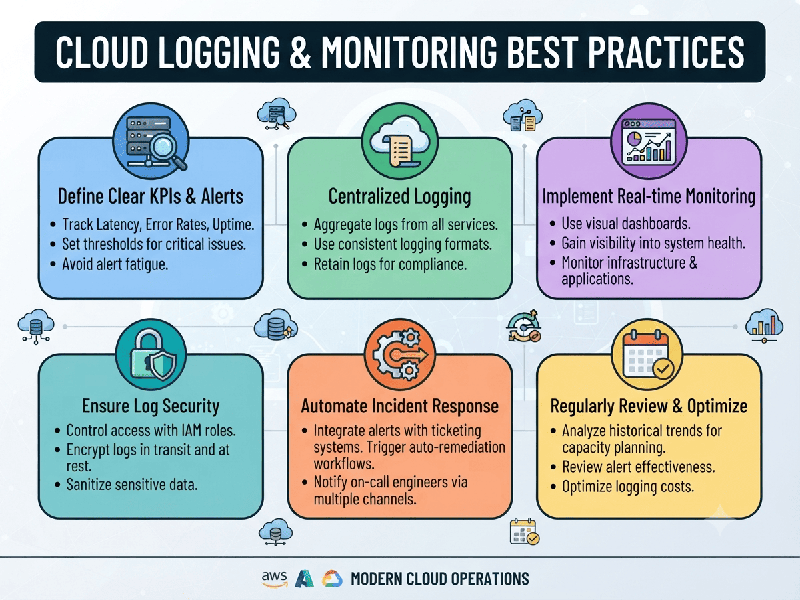
Cloud Logging & Monitoring Best Practices
Effective cloud logging and monitoring move beyond
simply collecting metrics and storing text files. They form a unified
observability strategy that minimizes Mean Time to Resolution (MTTR), controls
infrastructure costs, and ensures high system reliability.
1. Structure and Standardize Logging Data
- Adopt Structured Logging (JSON): Write logs in structured
formats like JSON rather than plain text. This allows log aggregators to
automatically index keys, making queries and filtering significantly
faster.
- Inject Trace Context: Every log line generated by an
application request should include a unique trace_id and span_id. This
allows engineers to jump seamlessly from a metric spike or an error log
directly into the corresponding distributed trace.
- Enforce Strict Log Levels: Use appropriate log levels
(DEBUG, INFO, WARN, ERROR, FATAL) consistently. Reserve ERROR and FATAL
for events that genuinely require immediate engineering intervention or
indicate system degradation.
- Scrub Sensitive Data
(PII/Secrets):
Implement automated masking or regex filtering at the ingestion layer to
prevent Personally Identifiable Information (PII), passwords, API keys,
and tokens from landing in log storage.
2. Streamline Metrics & Alerting Strategy
- Focus on Golden Signals &
RED/USE Methods:
Base your primary infrastructure and application health dashboards on
standard indicators:
o RED (for microservices/APIs): Rate (requests per second), Errors
(failed requests), Duration (latency distribution).
o USE (for physical/virtual resources): Utilization, Saturation,
Errors.
- Alert on User-Centric SLOs, Not
Infrastructure Noise: Shift away from alerting on every minor CPU or memory spike.
Instead, alert on Service Level Objectives (SLOs) and error budget burn
rates that directly reflect customer friction.
- Combat Alert Fatigue: Group related alerts, eliminate
flapping or transient notifications, and ensure every firing alert has a
documented runbook link attached to it.
3. Implement Intelligent Data Management & Cost
Control
- Tiered Storage and Retention
Policies: Avoid
keeping all logs and metrics in high-performance hot storage indefinitely.
Route high-frequency operational data to hot storage for quick
troubleshooting (e.g., 7–30 days) and transition older logs to cheap
object storage (e.g., S3/Cloud Storage cold tiers) for compliance and
auditing.
- Control Cardinality Explosions: Prevent metrics labels from
blowing up storage costs. Never use unbounded variables like
high-frequency user IDs, raw email addresses, or unmasked URL paths as
metric dimension labels.
- Adopt Adaptive Sampling: For high-volume environments
(such as high-throughput API gateways or microservices), implement smart
trace and log sampling to retain 100% of error traces while capturing only
a representative percentage of successful routine traffic.
4. Unify the Observability Stack
- Break Down Silos: Centralize logs, metrics, and
traces into a cohesive query plane. Teams should not have to swivel-chair
between three completely disconnected dashboards to figure out why an
application is failing.
- Embrace Open Standards: Leverage open-source telemetry
standards like OpenTelemetry for instrumentation. This avoids
vendor lock-in, standardizes agent deployment, and lets you route data to
your backend of choice (e.g., Prometheus, Grafana Loki, Datadog, or
Elasticsearch).