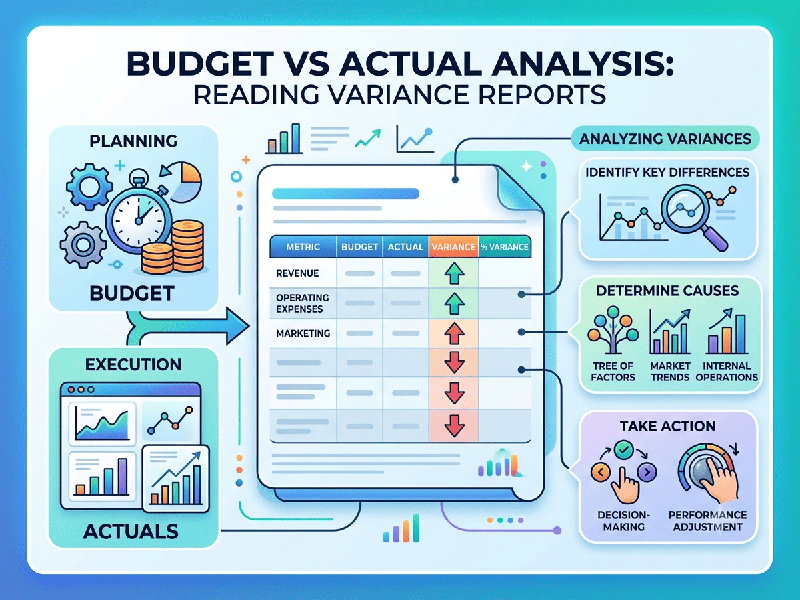
Budget vs Actual Analysis: Reading Variance Reports
A Budget vs. Actual (BvA) analysis compares
your projected financial plan against what actually happened over a specific
period. It is one of the most powerful management tools for controlling costs,
protecting profit margins, and spotting operational bottlenecks before they
threaten business stability.
Reading variance reports effectively transforms raw
numbers into strategic foresight.
Anatomy of a Variance Report
A standard BvA report typically includes five core
columns:
Line Item: The specific revenue or expense account (e.g., Software
Subscriptions, Direct Materials).
Budget (Planned): The targeted financial figure approved for the
period.
Actual: The real-world financial figure recorded in your general
ledger.
Variance ($): The absolute monetary difference between Actual and Budget.
Variance (%): The percentage change, calculated as:
Favorable vs. Unfavorable Variances
Interpreting a variance requires context. A positive
number is not always good, and a negative number is not always bad:
Revenue Accounts:
Favorable (F): Actual revenue is higher than budgeted (sales
outperformed projections).
Unfavorable (U): Actual revenue is lower than budgeted (sales
underperformed).
Expense Accounts (COGS & OpEx):
Favorable (F): Actual expenses are lower than budgeted (you spent
less than planned).
Unfavorable (U): Actual expenses are higher than budgeted (you
overspent or costs rose unexpectedly).
When reviewing your monthly or quarterly variance
report, avoid investigating every minor discrepancy. Focus your energy where it
matters most:
Establish Materiality Thresholds: Define a rule for investigation
(e.g., investigate any variance that exceeds both
Deconstruct the Driver (Volume vs. Rate):
A cost variance is often driven by either volume
(you consumed more units than expected) or rate/price (the unit price of
the item increased). Determine which factor moved.
Check for Timing Differences: Sometimes an unfavorable variance is
just a matter of timing. If an annual software license or insurance premium was
billed in October instead of November, it creates a temporary spike that
corrects itself next month.
Conduct Root-Cause Analysis: Meet with department heads to
understand why the variance occurred. Did client delivery delays stall
invoicing? Did unexpected freight surcharges spike shipping costs?
Adapt and Re-forecast: If a variance indicates a permanent
shift in market conditions (e.g., raw material costs permanently rising by
15%), update your future forecasts rather than assuming the original budget is
still realistic.