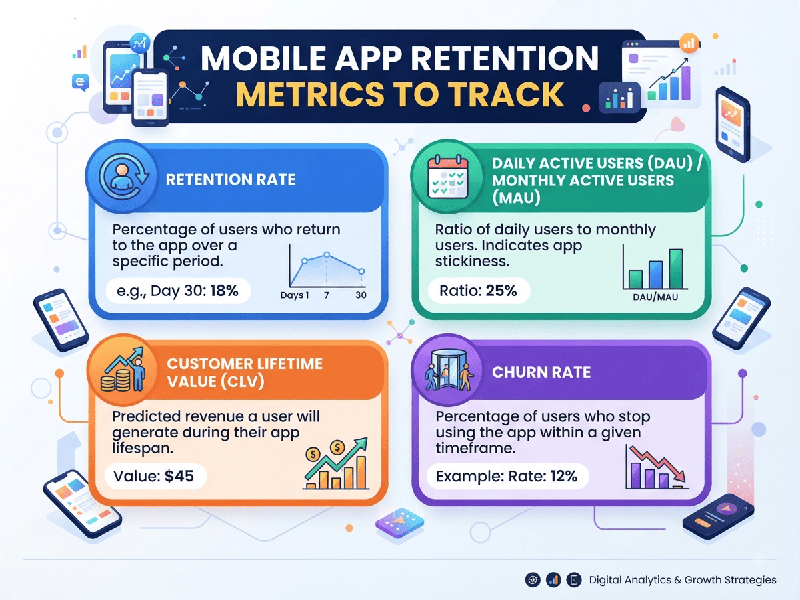
Mobile App Retention Metrics to Track
Mobile App Retention Metrics track how consistently users return
to your app after their initial download, serving as the ultimate indicator of
product-market fit, user engagement, and long-term viability.
Core Retention Metrics
1. User Retention Rate (Day N Retention)
Measures the percentage of users who return to use the
app on a specific day following their installation date.
- Day 1 (D1): Measures initial onboarding
success and immediate value realization.
- Day 7 (D7): Indicates whether the app has
woven itself into the user's weekly routine.
- Day 30 (D30): The gold standard for long-term
loyalty and product stickiness.
2. Churn Rate (The Inverse of Retention)
The percentage of users who stop using your app or
uninstall it over a given timeframe.
- Formula:
- Why it matters: High churn signals friction in
the user journey, poor engagement loops, or unmet expectations.
3. Sticky Factor (DAU/MAU Ratio)
Calculates the ratio of Daily Active Users (DAU) to
Monthly Active Users (MAU). It shows how frequently your active base engages
with the app on a daily basis.
- Formula:
- Benchmark: A ratio above 20% is typically
considered strong; social and messaging apps often aim for 50%+.
4. Session Frequency & Length
Measures how often users open the app and how
long they stay during each session.
- Session Length: Average duration of an active
app session.
- Sessions per User: How many times a user opens the
app daily or weekly. High frequency combined with steady retention
indicates deep habit formation.
Advanced Behavioral & Value Metrics
1. Feature Adoption Rate
Tracks whether users are interacting with the core
features that deliver your app's primary value proposition. Users who adopt
core features early are significantly less likely to churn.
2. Time-to-Value (TTV)
Measures how long it takes a new user to experience a
meaningful benefit after downloading the app. Shorter TTV directly correlates
with higher Day 7 and Day 30 retention.
3. Cohort Retention Analysis
Grouping users based on shared characteristics (e.g.,
installation month, acquisition channel, or onboarding path) and tracking their
retention curves over time. This helps pinpoint which marketing channels or
product updates drive lasting loyalty.