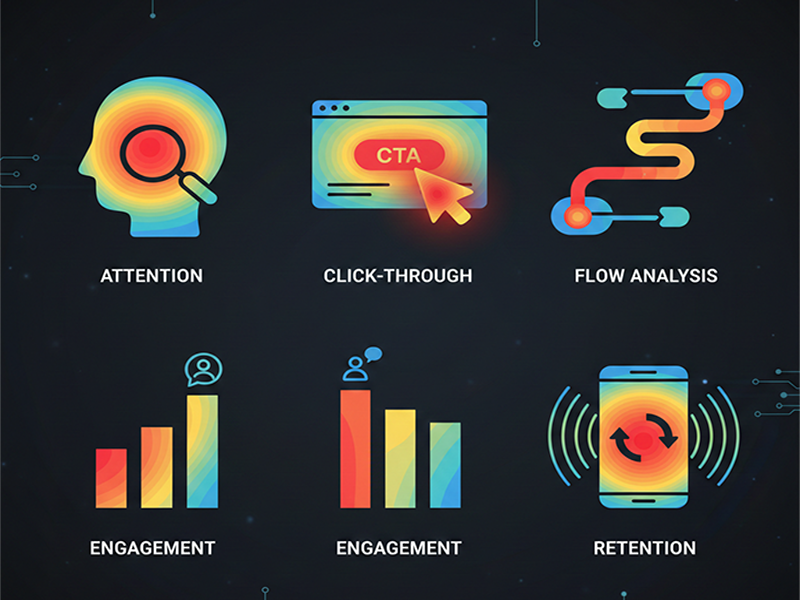
Heatmaps for UX Insights
Heatmaps are
recognized as essential visual tools for understanding user interaction density
on digital platforms. By aggregating data from many users, they provide a
color-coded "thermal" view that highlights areas of high engagement
("hot" zones in red) and neglect ("cold" zones in
blue).
Core
Types of UX Heatmaps
- Click/Tap Maps: Identify exactly where
users click (desktop) or tap (mobile). These are vital for spotting rage
clicks—repeated, frustrated clicks on unresponsive elements—and
"dead clicks" on non-interactive visuals.
- Scroll Maps: Show how far down a page
users travel. These help designers identify "false bottoms"
where users think a page ends, and ensure critical Call-to-Action (CTA) buttons are placed above
the average drop-off point.
- Move/Mouse-Tracking Maps: Track cursor movement to
infer where users are looking and reading, serving as a cost-effective
alternative to eye-tracking.
- Attention/Engagement Zones: Advanced maps that combine
click, move, and scroll data to show which sections truly capture user
focus over time.
- Predictive AI Heatmaps: Emerging tools that use AI
to predict user attention patterns on a design before it even goes
live.
Leading
2026 UX Heatmap Tools
- Hotjar (by Contentsquare): Popular for combining
heatmaps with feedback widgets and surveys.
- Microsoft Clarity: A powerful, free tool
favored by startups for tracking rage clicks and frustration signals.
- UXCam: The industry standard for
mobile apps, capturing mobile-specific gestures like swipes and
multi-finger taps.
- Smartlook: Offers retroactive heatmap
generation and integrated session recordings for both web and mobile.
- Crazy Egg: Known for
"Confetti" reports that segment clicks by referral source (e.g.,
social media vs. direct).
Strategic
Benefits for UX Design
- Validating A/B Tests: Heatmaps reveal why a
design variant won or lost by showing changed interaction patterns.
- Data-Backed Buy-in: They provide intuitive,
visual evidence to help stakeholders understand the need for specific
redesigns without needing deep data science training.
- Mobile Optimization: Comparing mobile vs.
desktop heatmaps helps teams refine responsive designs for better
device-specific engagement.
- Continuous Improvement: By regularly reviewing
heatmaps, teams can spot "experience breakages" as user habits
or browser updates change over time.